1978 Runnymede Borough Council election
Elections to Runnymede Borough Council were held on 4 May 1978. One third of the council was up for election and the Conservative party retained overall control of the council, despite losing a seat.
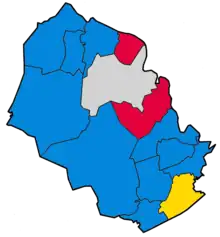
Map showing the party of the candidate with the most votes in each ward
After the election, the composition of the council was
- Conservative 30
- Labour 7
- Thorpe Residents Association 3
- Liberal 2
Election result
| Runnymede Borough Council Election 1978 | ||||||||||
|---|---|---|---|---|---|---|---|---|---|---|
| Party | This election | Full council | This election | |||||||
| Seats | Net | Seats % | Other | Total | Total % | Votes | Votes % | +/− | ||
| Conservative | 10 | 71.4 | 20 | 30 | 71.4 | 12,416 | 58.7 | +0.2% | ||
| Labour | 2 | 14.3 | 5 | 7 | 16.7 | 4,763 | 22.5 | -3.2% | ||
| Liberal | 1 | 7.1 | 1 | 2 | 4.8 | 3,076 | 14.5 | +5.4% | ||
| Residents | 1 | 7.1 | 2 | 3 | 7.1 | 910 | 4.3 | -1.5% | ||
Ward results
| Party | Candidate | Votes | % | ±% | |
|---|---|---|---|---|---|
| Conservative | P. Quaife | 760 | 47.3 | +1.6 | |
| Labour | S. Allen | 624 | 38.8 | +1.5 | |
| Liberal | H. Fotheringham | 224 | 13.9 | -3.1 | |
| Majority | 136 | 8.5 | |||
| Turnout | 1,608 | 39.3 | +5.3 | ||
| Conservative hold | Swing | +0.1 | |||
| Party | Candidate | Votes | % | ±% | |
|---|---|---|---|---|---|
| Conservative | M. Taylor | 858 | 56.8 | +4.8 | |
| Labour | C. Watts | 419 | 27.7 | +0.0 | |
| Liberal | Geoffrey Pyle | 233 | 15.4 | -4.9 | |
| Majority | 439 | 29.1 | |||
| Turnout | 1,510 | 40.9 | +2.5 | ||
| Conservative hold | Swing | +2.4 | |||
| Party | Candidate | Votes | % | ±% | |
|---|---|---|---|---|---|
| Conservative | D. Tuckwood | 1,000 | 59.5 | +17.1 | |
| Liberal | S. O'Byrne | 343 | 20.4 | -21.4 | |
| Labour | A. Brentnall | 339 | 20.2 | +4.4 | |
| Majority | 657 | 39.1 | |||
| Turnout | 1,682 | 41.4 | -8.7 | ||
| Conservative hold | Swing | +19.3 | |||
| Party | Candidate | Votes | % | ±% | |
|---|---|---|---|---|---|
| Conservative | J. Ambrose | 1,165 | 68.1 | +26.7 | |
| Liberal | I. Geary | 546 | 31.9 | +18.0 | |
| Majority | 619 | 36.2 | |||
| Turnout | 1,711 | 35.2 | -25.0 | ||
| Conservative hold | Swing | +35.7 | |||
| Party | Candidate | Votes | % | ±% | |
|---|---|---|---|---|---|
| Labour | F. Bleach | 595 | 45.2 | +1.7 | |
| Conservative | B. Harmer | 416 | 31.6 | -1.5 | |
| Liberal | J. Elfer | 305 | 23.2 | -0.1 | |
| Majority | 179 | 22.3 | |||
| Turnout | 1,316 | 34.3 | -11.8 | ||
| Labour hold | Swing | +1.6 | |||
| Party | Candidate | Votes | % | ±% | |
|---|---|---|---|---|---|
| Conservative | A. Collins | 1,266 | 75.4 | +25.2 | |
| Labour | J. Capper | 414 | 24.6 | +7.0 | |
| Majority | 852 | 50.7 | |||
| Turnout | 1,680 | 38.1 | -18.0 | ||
| Conservative hold | Swing | +9.1 | |||
| Party | Candidate | Votes | % | ±% | |
|---|---|---|---|---|---|
| Conservative | D. Head | 875 | 79.8 | +1.2 | |
| Labour | J. Purbrick | 221 | 20.2 | -1.2 | |
| Majority | 654 | 59.7 | |||
| Turnout | 1,096 | 34.5 | -10.1 | ||
| Conservative hold | Swing | +1.2 | |||
| Party | Candidate | Votes | % | ±% | |
|---|---|---|---|---|---|
| Conservative | J. Fowles | 728 | 58.5 | +8.6 | |
| Labour | R. Boreham | 517 | 41.5 | +4.2 | |
| Majority | 211 | 16.9 | |||
| Turnout | 1,245 | 37.3 | -7.1 | ||
| Conservative hold | Swing | +2.2 | |||
| Party | Candidate | Votes | % | ±% | |
|---|---|---|---|---|---|
| Conservative | J. Walbridge | 766 | 71.7 | +4.0 | |
| Liberal | C. Boyde | 303 | 28.3 | -4.0 | |
| Majority | 463 | 43.3 | |||
| Turnout | 1,069 | 31.8 | +12.7 | ||
| Conservative hold | Swing | +4.0 | |||
| Party | Candidate | Votes | % | ±% | |
|---|---|---|---|---|---|
| Labour | D. Baker | 948 | 54.5 | -5.5 | |
| Conservative | K. Richards | 792 | 45.5 | +5.5 | |
| Majority | 156 | 9.0 | |||
| Turnout | 1,740 | 24.5 | +2.7 | ||
| Labour hold | Swing | -5.5 | |||
| Party | Candidate | Votes | % | ±% | |
|---|---|---|---|---|---|
| Liberal | Kenneth Graham | 810 | 44.6 | +15.3 | |
| Conservative | D. Clarke | 752 | 43.6 | -5.0 | |
| Labour | A. Anderson | 205 | 11.9 | -10.2 | |
| Majority | 58 | 1.0 | |||
| Turnout | 1,767 | 47.4 | -11.1 | ||
| Liberal gain from Conservative | Swing | +10.2 | |||
| Party | Candidate | Votes | % | ±% | |
|---|---|---|---|---|---|
| Residents | Eiry Price | 910 | 49.7 | -13.5 | |
| Conservative | E. Stamp | 797 | 43.6 | New | |
| Labour | A. Sandey | 123 | 6.7 | -9.9 | |
| Majority | 113 | 6.2 | |||
| Turnout | 1,830 | 50.7 | -16.0 | ||
| Residents hold | Swing | -28.6 | |||
| Party | Candidate | Votes | % | ±% | |
|---|---|---|---|---|---|
| Conservative | R. Hervey | 1,197 | 90.1 | +1.0 | |
| Labour | N. Williams | 132 | 9.9 | -1.0 | |
| Majority | 1,065 | 80.1 | |||
| Turnout | 1,329 | 41.8 | +5.8 | ||
| Conservative hold | Swing | +1.0 | |||
| Party | Candidate | Votes | % | ±% | |
|---|---|---|---|---|---|
| Conservative | E. Hargreaves | 1,044 | 66.0 | -1.4 | |
| Liberal | R. Morrall | 312 | 19.7 | -12.9 | |
| Labour | G. Honeyball | 226 | 14.3 | New | |
| Majority | 732 | 46.3 | |||
| Turnout | 1,582 | 41.8 | +2.0 | ||
| Conservative hold | Swing | +5.8 | |||
References
| London boroughs |
|
|---|---|
| Metropolitan boroughs |
|
| District councils (England) |
|
| Regional councils (Scotland) |
|
This article is issued from Wikipedia. The text is licensed under Creative Commons - Attribution - Sharealike. Additional terms may apply for the media files.