Wakefield Metropolitan District Council elections
One third of Wakefield Metropolitan District Council in West Yorkshire, England is elected each year for 3 years, followed by one year without an election. 63 councillors are elected with 3 from each of the 21 wards.[1]
Political control
From 1889 until 1974 Wakefield was a county borough, independent from any county council. Under the Local Government Act 1972 it had its territory enlarged and became a metropolitan borough, with West Yorkshire County Council providing county-level services. The first election to the reconstituted city council was held in 1973, initially operating as a shadow authority before coming into its revised powers on 1 April 1974. West Yorkshire County Council was abolished in 1986 and Wakefield became a unitary authority. Political control of the council since 1973 has been held by the following parties:[2][3]
| Party in control | Years | |
|---|---|---|
| Labour | 1973–present | |
Leadership
The leaders of the council since 1998 have been:[4]
| Councillor | Party | From | To | |
|---|---|---|---|---|
| Peter Box | Labour | 1998 | 30 Nov 2019 | |
| Denise Jeffery | Labour | 1 Dec 2019 | ||
Council elections
- 1998 Wakefield Metropolitan District Council election
- 1999 Wakefield Metropolitan District Council election
- 2000 Wakefield Metropolitan District Council election
- 2002 Wakefield Metropolitan District Council election
- 2003 Wakefield Metropolitan District Council election
- 2004 Wakefield Metropolitan District Council election (whole council elected after boundary changes)[5]
- 2006 Wakefield Metropolitan District Council election
- 2007 Wakefield Metropolitan District Council election
- 2008 Wakefield Metropolitan District Council election
- 2010 Wakefield Metropolitan District Council election
- 2011 Wakefield Metropolitan District Council election
- 2012 Wakefield Metropolitan District Council election
- 2014 Wakefield Metropolitan District Council election
- 2015 Wakefield Metropolitan District Council election
- 2016 Wakefield Metropolitan District Council election
- 2018 Wakefield Metropolitan District Council election
- 2019 Wakefield Metropolitan District Council election
- 2021 Wakefield Metropolitan District Council election
- 2022 Wakefield Metropolitan District Council election
Borough result maps
 2006 results map
 2007 results map
 2008 results map
 2010 results map
 2011 results map
 2012 results map
 2014 results map
 2015 results map
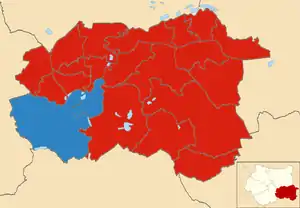 2016 results map
 2018 results map
 2019 results map
 2021 results map
By-election results
1993-2001
| Party | Candidate | Votes | % | ±% | |
|---|---|---|---|---|---|
| Labour | Tony Richardson | 988 | 49.3 | -22.8 | |
| Conservative | Kenneth Blackburn | 661 | 33.0 | +15.4 | |
| Liberal Democrats | Mark Goodair | 356 | 17.8 | +7.4 | |
| Majority | 327 | 16.3 | |||
| Turnout | 2,005 | 17.9 | |||
| Labour hold | Swing | ||||
| Party | Candidate | Votes | % | ±% | |
|---|---|---|---|---|---|
| Labour | 833 | 55.0 | +2.7 | ||
| Conservative | 511 | 37.7 | -1.7 | ||
| Liberal Democrats | Douglas Dale | 171 | 11.3 | -1.0 | |
| Majority | 322 | 17.3 | |||
| Turnout | 1,515 | 14.1 | |||
| Labour hold | Swing | ||||
2001-2009
| Party | Candidate | Votes | % | ±% | |
|---|---|---|---|---|---|
| Labour | 3,013 | 51.8 | +3.2 | ||
| Conservative | 2,004 | 34.5 | -5.3 | ||
| Liberal Democrats | Mark Goodair | 797 | 13.7 | +2.1 | |
| Majority | 1,009 | 17.3 | |||
| Turnout | 5,814 | 54.6 | |||
| Labour hold | Swing | ||||
| Party | Candidate | Votes | % | ±% | |
|---|---|---|---|---|---|
| Labour | 848 | 42.7 | +10.3 | ||
| Conservative | 605 | 30.4 | -14.6 | ||
| Liberal Democrats | Mark Goodair | 405 | 20.4 | -2.2 | |
| Independent | 69 | 3.5 | +3.5 | ||
| Independent | 60 | 3.0 | +3.0 | ||
| Majority | 243 | 12.3 | |||
| Turnout | 1,987 | 16.5 | |||
| Labour hold | Swing | ||||
| Party | Candidate | Votes | % | ±% | |
|---|---|---|---|---|---|
| Labour | David Watts | 1,156 | 38.2 | +9.4 | |
| Conservative | Glenn Armitage | 1,110 | 36.6 | +10.2 | |
| Liberal Democrats | Mark Goodair | 764 | 25.2 | +4.4 | |
| Majority | 46 | 1.6 | |||
| Turnout | 3,030 | 26.0 | |||
| Labour gain from Conservative | Swing | ||||
2009-2017
| Party | Candidate | Votes | % | ±% | |
|---|---|---|---|---|---|
| Labour | Les Shaw | 1,330 | 49.9 | +3.2 | |
| Liberal Democrats | Paul Kirby | 603 | 22.6 | +8.3 | |
| BNP | Stephen Rogerson | 353 | 13.3 | -7.7 | |
| Conservative | Carl Milner | 275 | 10.3 | -7.7 | |
| Independent | Jason Smart | 102 | 3.8 | +3.8 | |
| Majority | 727 | 27.3 | |||
| Turnout | 2,663 | 23.4 | |||
| Labour hold | Swing | ||||
| Party | Candidate | Votes | % | ±% | |
|---|---|---|---|---|---|
| Labour | Janet Holmes | 1,776 | 51.4 | +2.2% | |
| Conservative | Richard Wakefield | 1061 | 30.7 | -10.5% | |
| UKIP | David Dews | 232 | 6.7 | +6.7% | |
| Liberal Democrats | Mark Goodair | 200 | 5.8 | -3.7% | |
| Independent | Norman Tate | 93 | 2.7 | +2.7 | |
| Independent | Mark Harrop | 88 | 2.5 | +2.5 | |
| Majority | 715 | 20.7 | |||
| Turnout | 3, 454 | 28.6 | |||
| Labour gain from Conservative | Swing | ||||
| Party | Candidate | Votes | % | ±% | |
|---|---|---|---|---|---|
| Labour | Richard Forster | 1,567 | 76.7 | ||
| UKIP | Nathan Garbutt | 349 | 17.1 | ||
| Conservative | Anne-Marie Glover | 95 | 4.6 | ||
| Liberal Democrats | Mark Goodair | 33 | 1.6 | ||
| Majority | 1218 | 60.0 | |||
| Turnout | 2,044 | 16.9 | |||
| Labour hold | Swing | ||||
| Party | Candidate | Votes | % | ±% | |
|---|---|---|---|---|---|
| Labour | Rory Bickerton | 1,061 | 40.3 | -0.2% | |
| UKIP | Graham Jesty | 856 | 32.5 | +22.5 | |
| Conservative | Angela Howell | 504 | 19.1 | -3.7 | |
| Liberal Democrats | Mark Goodair | 212 | 8.1 | -0.2 | |
| Majority | 205 | 7.8 | |||
| Turnout | 2, 633 | 20.77 | |||
| Labour hold | Swing | ||||
| Party | Candidate | Votes | % | ±% | |
|---|---|---|---|---|---|
| Labour | Lorna Malkin | 909 | |||
| UKIP | Nathan Garbutt | 453 | |||
| Conservative | Anthony Hill | 299 | |||
| Yorkshire First | Lucy Brown | 124 | |||
| Liberal Democrats | Daniel Woodlock | 86 | |||
| TUSC | Daniel Dearden | 24 | |||
| Majority | |||||
| Turnout | |||||
| Labour hold | Swing | ||||
| Party | Candidate | Votes | % | ±% | |
|---|---|---|---|---|---|
| Labour | Jack Spencer Hemmingway | 1,353 | 51.0 | +2.4 | |
| Conservative | Nathan Garbutt Moore | 847 | 31.9 | +7.3 | |
| Liberal Democrats | Nicola Kate Sinclair | 165 | 6.2 | +2.3 | |
| Yorkshire | Lucy Victoria Brown | 153 | 5.8 | +5.8 | |
| UKIP | James Lee Johnston | 136 | 5.1 | -16.4 | |
| Majority | 506 | 19.1 | |||
| Turnout | 2,655 | 21.5 | |||
| Labour hold | Swing | ||||
| Party | Candidate | Votes | % | ±% | |
|---|---|---|---|---|---|
| Labour | Michael Paul Graham | 1,118 | 49.6 | ||
| Conservative | Dawn Lesley Hunt | 933 | 41.4 | ||
| Yorkshire | Paul Phelps | 152 | 6.7 | ||
| Liberal Democrats | Peter John Williams | 46 | 2.0 | ||
| Majority | 185 | 8.2 | |||
| Turnout | 2253 | 20.6 | |||
| Labour hold | Swing | ||||
References
- "How the Council Works". www.wakefield.gov.uk. Retrieved 12 August 2009.
- "Compositions calculator". The Elections Centre. Retrieved 10 August 2022.
- "Wakefield". BBC News Online. 19 April 2008. Retrieved 3 December 2009.
- "Council minutes". Wakefield Council. Retrieved 12 August 2022.
- "Wakefield council". BBC News Online. Retrieved 12 August 2009.
- Mason, Christine (1998). Declaration of Result of Poll: Wakefield Central ward by-election (PDF). Wakefield Council. p. 1. Archived (PDF) from the original on 24 April 2020.
- "Horbury and South Ossett No 8 ward by-election 21 April 2005 - result" (PDF). www.wakefield.gov.uk. Retrieved 12 August 2009.
- "Labour victory in key Wakefield by-election". BBC News Online. 22 January 2010. Retrieved 22 January 2010.
External links
| Mayor | |
|---|---|
| Bradford | |
| Calderdale | |
| Kirklees | |
| Leeds |
|
| Wakefield | |
| West Yorkshire CC | |
| West Riding CC | |
| |
