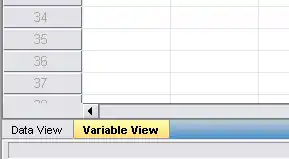
The Variable View tab is another tab in the Data Editor window in addition to the Data View tab, which was discussed in the last chapter. Again, you can select between the tabs at the bottom left corner of the Data Editor Window:
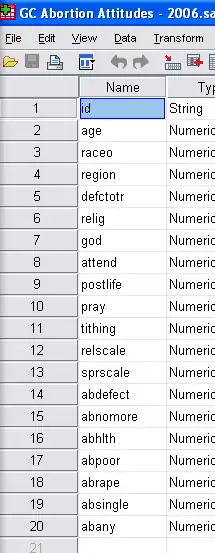
In Variable View, the rows correspond to variables, not cases. This view does not show raw data but rather metadata, information/settings/characteristics of the variables included in the data set. The metadata of two variables:
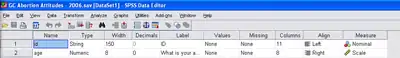
The columns provide information about the various characteristics of the variables. The "name" column with part of the "type" column:
There are 10 metadata columns total. Each explained:
| Column | What it Means |
|---|---|
| Name | The variable's name. Older versions of SPSS were limited to 8 character names. New versions of SPSS are not, but lengthy descriptions better belong in the Label column. |
| Type | The data type of the variable. There are 8 options: Numeric, Comma, Dot, Scientific notation, Date, Dollar, Custom currency, and String. Most variables that beginning users will encounter will be either Numeric or String. Numeric variables are numbers that either map to a value (e.g., 1=Catholic) or are the value of interest (height=73 inches). String numbers are text and can only be treated as such. As a result, very few manipulations can be performed on them. |
| Width | This column indicates the number of characters available for the variable values. |
| Decimals | This column allows you to control the number of numerals after the decimal place. |
| Label | This column allows you to provide a more extensive description of the variable. |
| Values | This column allows you to provide a key for what the numbers of a numeric variable may represent (e.g., 1=Catholic, 2=Protestant). |
| Missing | This column allows you to indicate which values mean missing. Values marked as missing are excluded from analyses in SPSS. |
| Columns | This column indicates the total number of columns a variable's values may have. |
| Align | This column indicates the alignment of the variable in the Data View, viz., Left, Right, or Center. |
| Measure | This last column indicates the level of measurement of the variable, viz., Nominal, Ordinal, or Scale. See next page. |
Every variable in your data set should have all columns that are relevant for it filled out. An example of an irrelevant column would be "Values" for an ID column, as that has a unique value in each row.